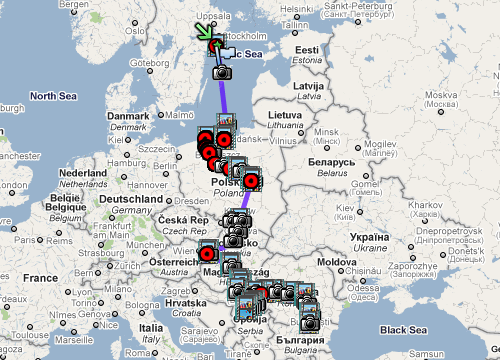
GPS data visualized
We’ve been on the road for a month now.
Here is this months (September/October 2010) statistics:
Movement
- 5 countries passed
- 4 borders crossed by foot and 1 by car
- 33 drivers (from Gdansk, Poland to Guirgui, Romania)
- 4272 km / 2 654 miles traveled
The Chicken Dance
- 10 public dances performed
Accommodation
- 5 nights spent wild camping
- 2 nights spent camping on organized camp sites
- 8 nights spent in hostels
- 8 nights spent CouchSurfing
- 3 nights spent in other peoples homes (not associated with any kind of network)
Blog activity
- 48 published posts
- 95 fans on Facebook
- 25 followers on Twitter
- 16 newsletter subscribers
- ~2000 visitors
- ~85 daily visitors
- 23 comments posted by engaged readers
- ~8 likes per post by loyal readers
Finances
- 5 SEK (1$/0,7€) earned from Google Adsense
- 110€ donated by readers who supports us financially (thank you again!)
- A daily budget of 13€ a person, for food, accommodation and local transports. That’s about 390€ per person.
We believe in full transparency, so you can expect to see a summary like this every month.
We can’t say anything else than that it’s been a huge success so far!
Many people have emailed us just to say that they feel very inspired, and that’s why were doing this.
We’re extremely passionate about this project.
This blog is not fully reader-supported yet (financially), but that’s what we’re working towards.
We believe that this project will be able to support itself in a few months.
Help us get there by donating today!
Thank you for reading, supporting and participating in our adventure.
Your engagement means a lot to us.
Love,
Robin and Amanda.
kära Amanda och Robin. Härligt att ni fått igång Gps-funktionen. Jag funderar på om man som betraktare kan använda den på något sett mer än att titta på den, och vad symbolerna betyder. Ulf
Ulf! Inte ännu men förhoppningsvis snart. Det du sett hittills är en bild av kartan, vi jobbar på fler funktioner. Håll ögonen öppna!